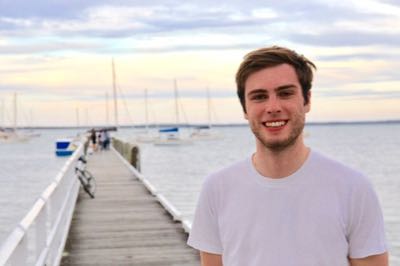
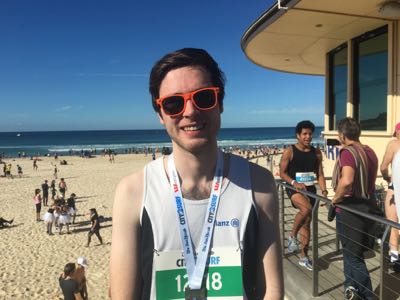
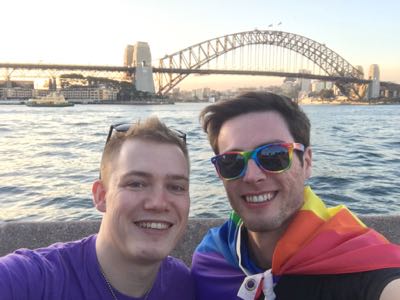
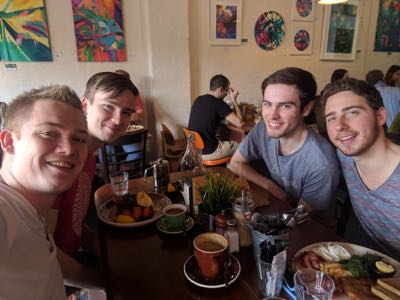
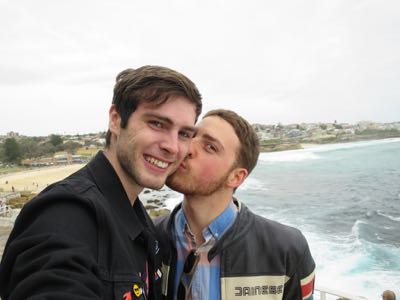
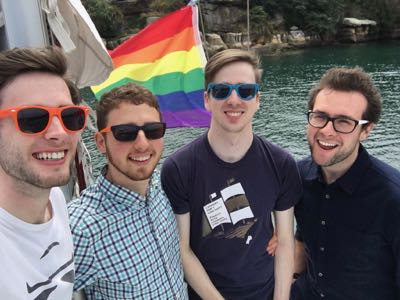
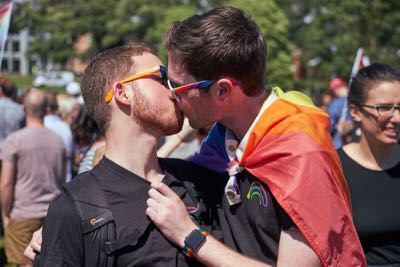
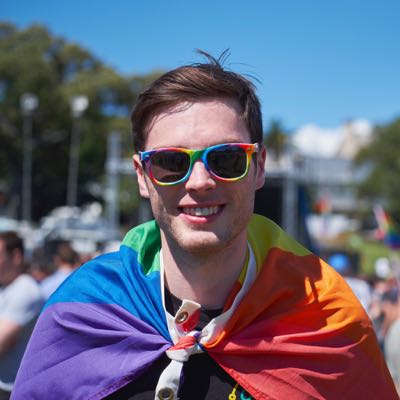
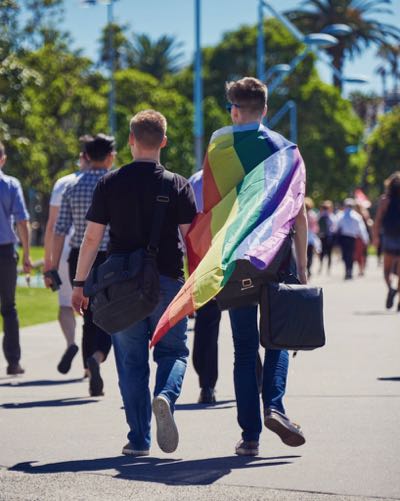
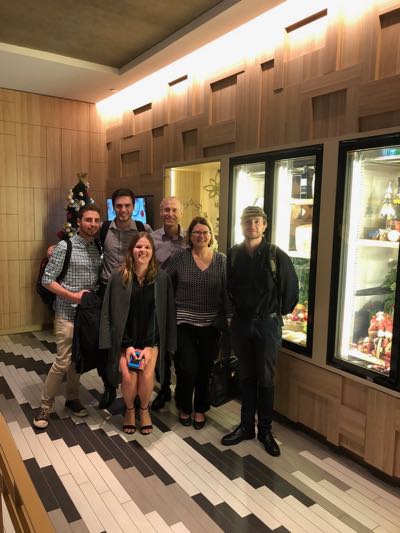
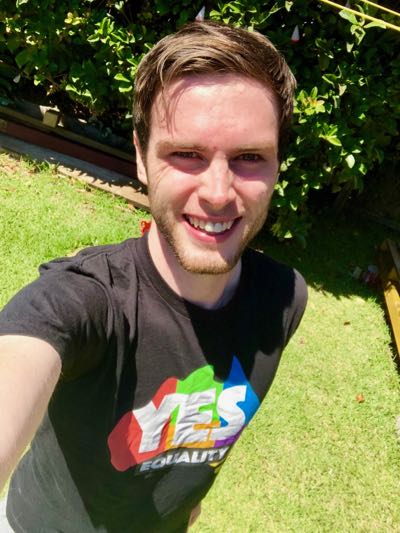
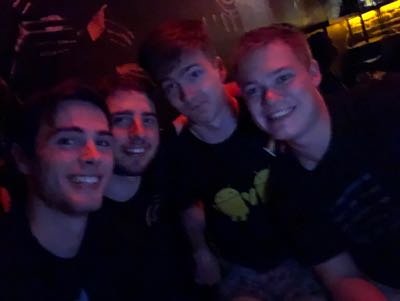
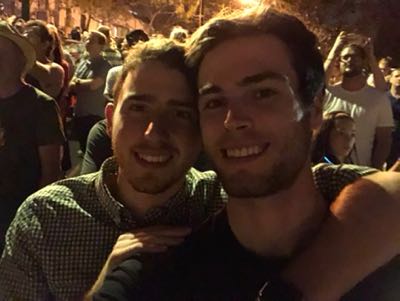
was quite a year, from three international trips, to speaking at two conferences, graduating from my double degree, and campaigning for marriage equality with my boyfriend by my side.
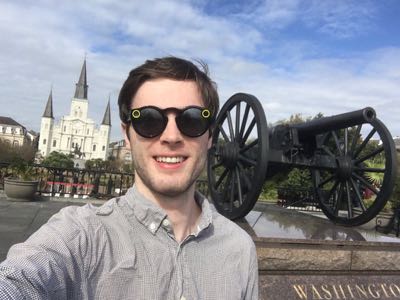
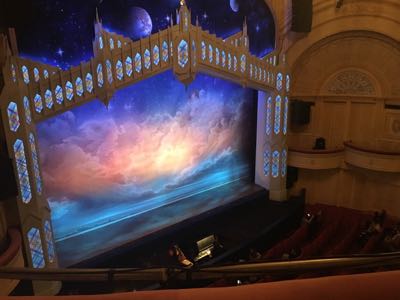
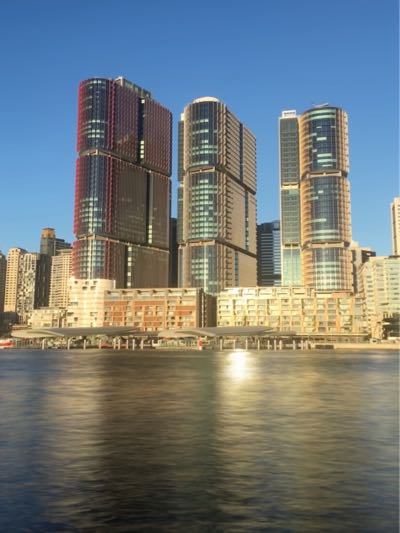
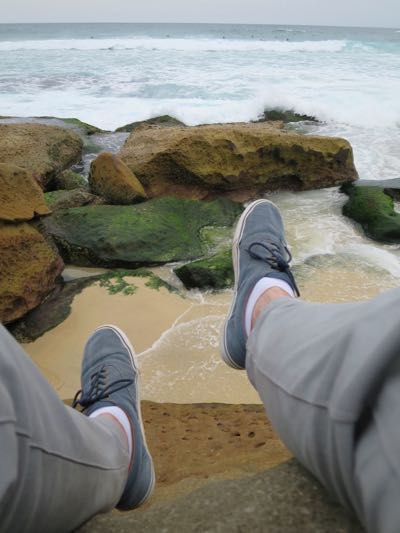
Every year my 'Year in Numbers' grows, this year is no exception, starting in Charlotte, North Carolina, and ending on the harbour foreshore in Sydney, this page summarises a whole year of Patrick, in numbers.
Total metrics displayed
81
That's a 70% increase from 2016.
There's also eight charts representing over two million data points.
01
Activity
At the end of 2016 I purchased an Apple Watch, which I wore every day of 2017. I don't know if it has made me any fitter or healtier, but it certainly has made me keenly aware of the times I do no excercise at all.
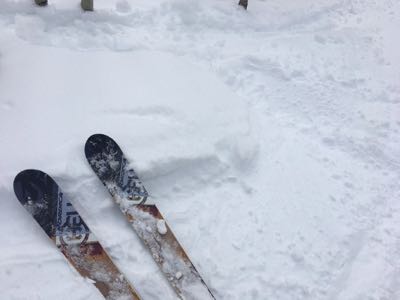
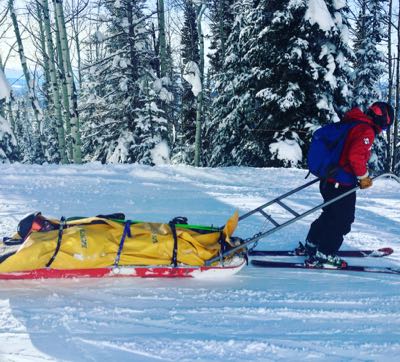
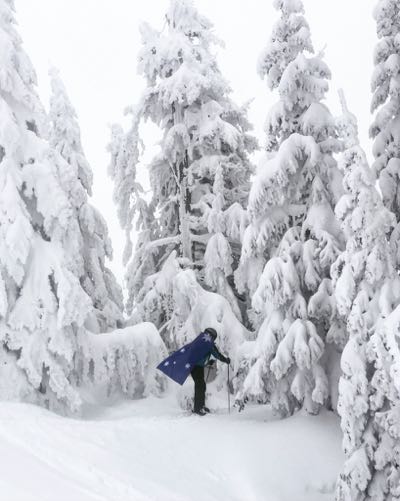
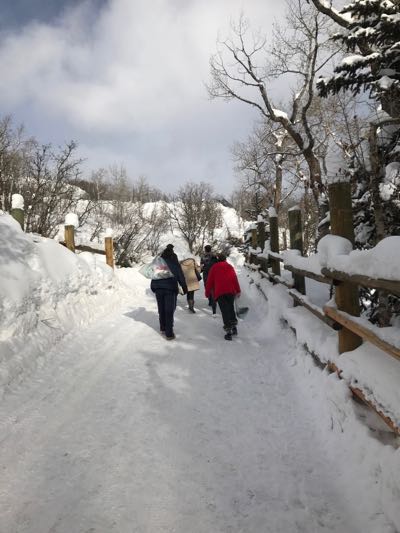
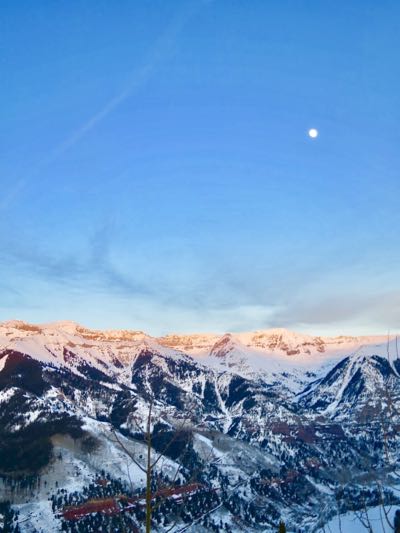
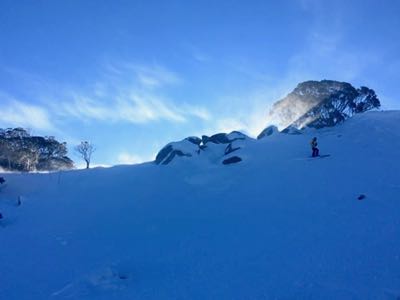
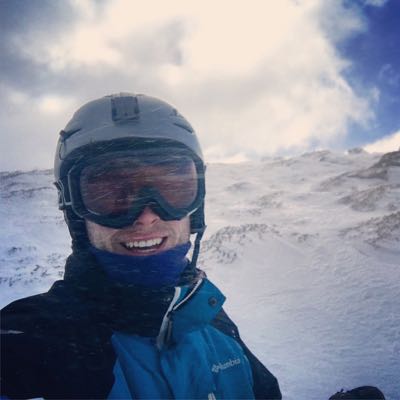
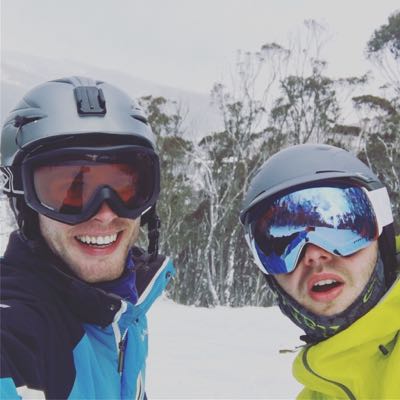
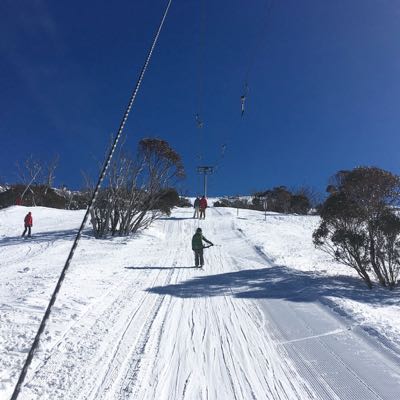
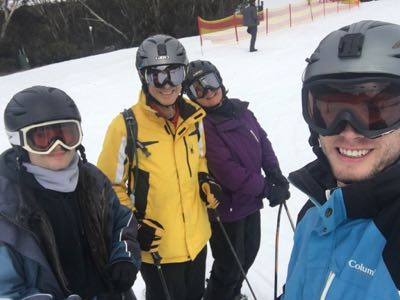
Skiing
Thanks to finding myself in the US during winter, 2017 had a lot of skiing. With over four weeks of skiing this year, it's not hard to see how I broke some of my records.
Vertical metres skied this year
151,000
That's eighteen trips from the top of Everest to sea level.
A 592% increase over last year.
Total Kilometres Skied
855
Across 450 ski runs.
Thats more than the distance from London to Frankfurt. 640% more than 2016.
Top speed skiing in KM/H
100.7
20 KM/H faster than last year.
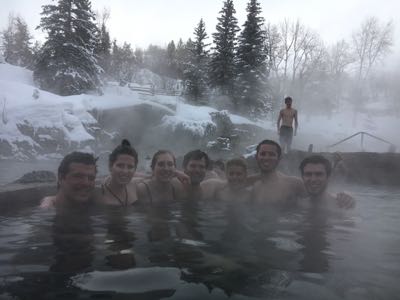
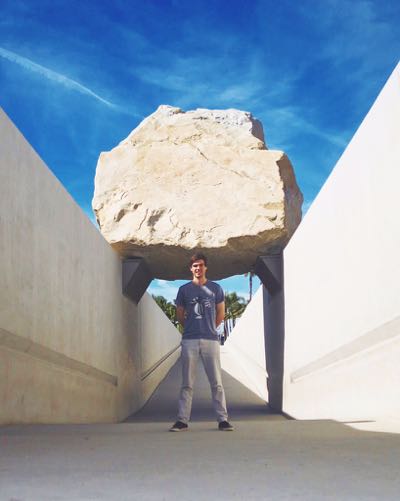
Walking
In June, Frederik and I decided to climb El Capitan in a day. It was stupid. It was fun. Combine that with tonnes of walking while travelling in January, and hill climbing through New Zealand in December; 2017 was a year of walking.
Total steps taken
2,832,417
A nineteen percent increase over last year
With 1 pm, being my most active hour in the day.
Total Kilometres Walked
2,317
Approximately the diameter of dwarf planet Pluto.
Steps Each Hour
through the months. (0 hour is midnight Sydney Time)
Heart
Wearing an Apple Watch every day for a year has opened up the ability to explore a timeline of my health, in particular my heart rate, this year.
Heart Rate for Every Day
Box-and-Whisker plot
Total heart beats
41,514,043
Making a yearly average heart rate of 79 bpm.
Highest heart rate BPM
215
The lowest high was 90 bpm on nine separate days.
With August 18 having the highest average of 160 bpm.
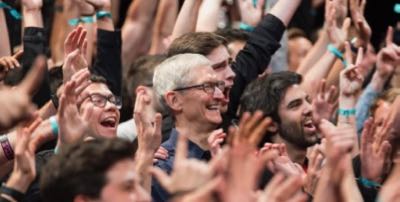
Greatest heart rate range BPM
176
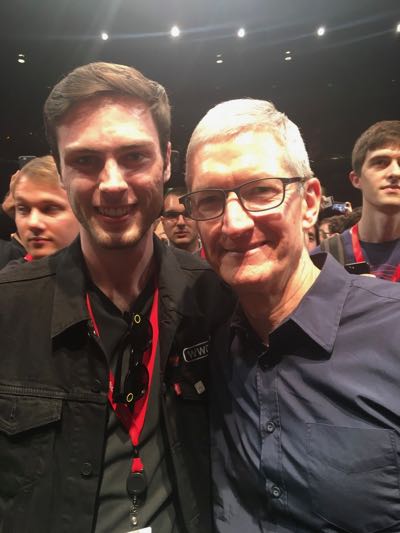
On the day of Apple's WWDC keynote in June.
Lowest heart rate BPM
30
On eight separate days.
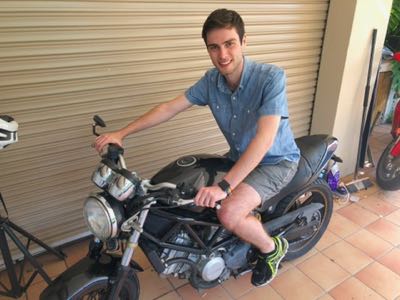
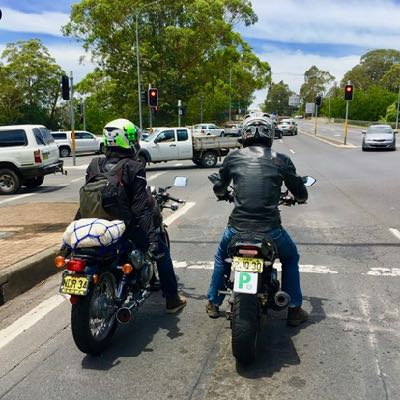
The highest low was 68 bpm, on December 29 at 9am riding my motorcycle.
02
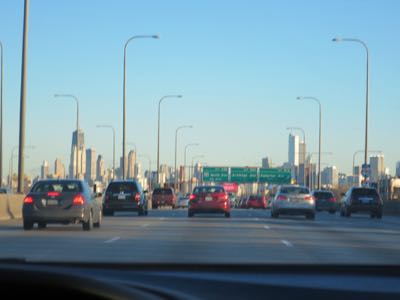
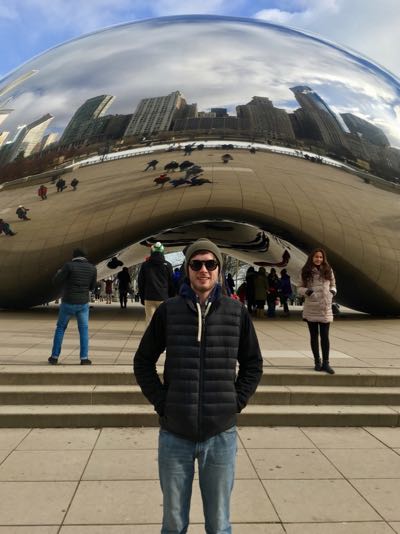
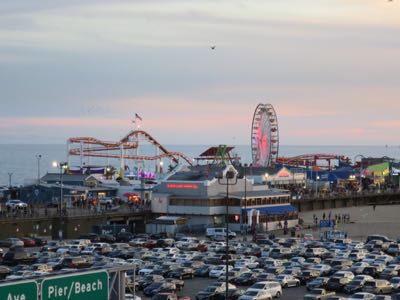
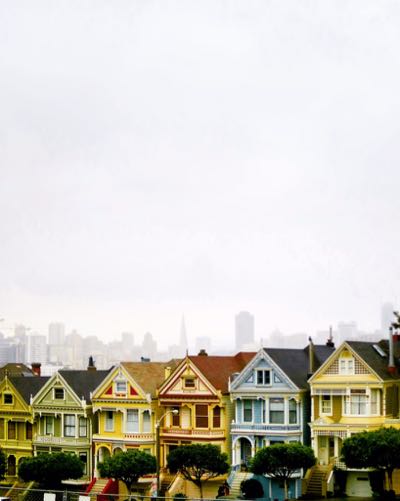
Travel
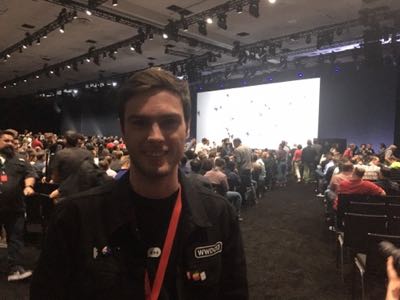
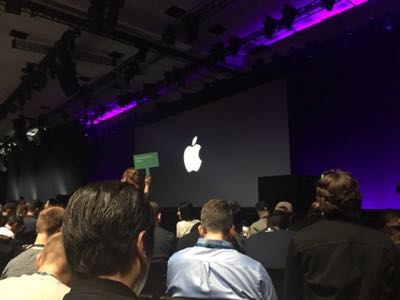
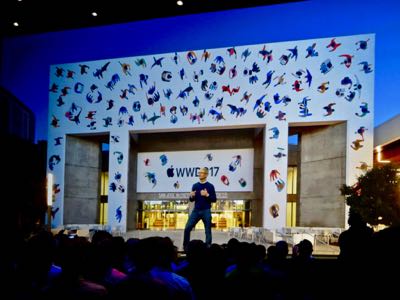
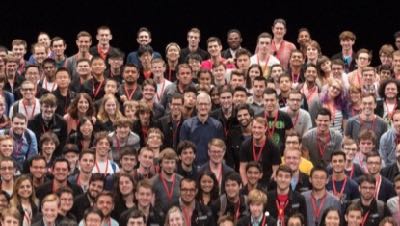
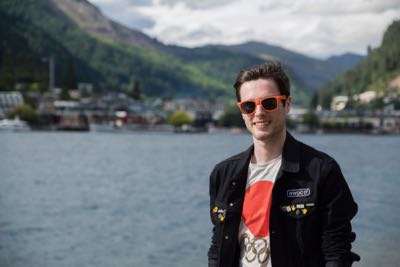
The year started, as it appears many do, out of the country. It saw me finish my trip across America that I started in 2016, return to San Fransico for WWDC, and visit New Zealand—Ignoring the domestic trips in between.
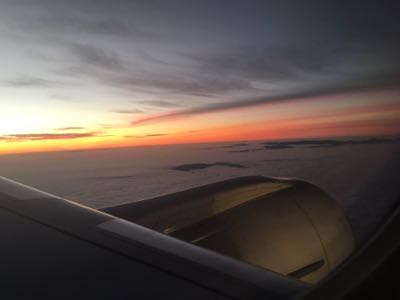
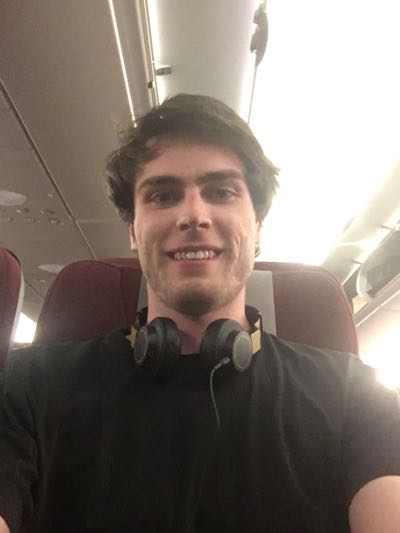
Flights
In 2017, I did a lot more flying than last year. I was out of the country for fewer days, but in the air for many more; making this my most flown year—beating 2015 by a few kilometres.
Total Kilometres flown
53,230
That's 30% more than the circumference of Earth.
The longest flight of the year was 12,060 km from Los Angeles to Sydney at the end of my exchange trip.
Total hours on planes
86
More than twice as many as the previous year, across 21 flights.
After Sydney, my most visited airports were Melbourne and Charlotte, NC.
Flights to-and-from Airports
Size equals Number of flights
Swarm
Swarm is a tool I use extensively when travelling, and almost not at all when I'm not. Having said that I checked-in more in Swarm this year than any previous year, just skewed more towards international trips.
Total Swarm Check-ins
1200
That’s 243 more check-ins than last year
Across four contries, and fourteen US states
New places visited
526
More than 56% of check-ins were in places I'd never been before.
Most visited places
Colleges
Cafés
Train Stations
Parks
Ski Areas
Other Transport
Cost of Public Transport in $AUD
536
Across 399 trips, activating $88 worth of discounts.
Opal only covers Sydney travel, and excludes half of my daily communtes to work.
03
Media
Music, Movies, TV, YouTube, Podcasts; the media consumption numbers of 2017 show a shift from 2016.
Music
The first Year in Numbers was nothing but music, so it is only fitting that music makes up a significant portion of my life.
Total Minutes Play Time
38,141
That’s 26 and a half days of play.
With You Will Be Found getting this highest play time.
Top Played Genres
Alternative
Soundtrack
Pop
Singer/Songwriter
Rock
Total Music Plays
9,922
That’s 15% fewer plays than 2016.
Across 2,345 unique songs.
New Songs Added
948
Bringing my library to 6,666 songs.
Of which, 902 songs were played only once.
Artists Listened To
527
From 833 artists in my library.
Top Played Artists
Radical Face
Jim Guthrie
Rob Simonsen
AJR
Coldplay
Wild
Kodaline
Coasts
Greg Laswell
Oh Wonder
The Coronas
Roo Panes
Imaginary Future
The National Parks
Chris Remo
Video
I watched a fair amount of Netflix and YouTube this year, thanks in part to travel and having YouTube Red Subscription.
Netflix Videos Watched
226
Of which only 10 were films, the rest part of series.
On my profile, since Netflix doesn't support multiple viewers I would guess I watched another two-hundred shows with others.
I'm only mildly concerned by the size of this number, and it definitely justifies YouTube Red.
04
Tech
2017 saw me finish university, start work, and build successful personal apps. Through all of this was my technology.
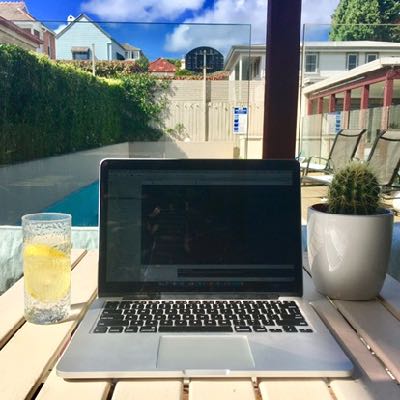
Computer
The always faithful RescueTime tracked all active time on my personal computer, showing that since I did less travel this year I spent more time online.
Computer Usage Hours
1,348
That’s 10 days more time logged than 2016.
With only 419 hours of 'distracting' time.
Hours using Xcode
126
With 3pm and 5pm being the heaviest usage in a day.
May (for university) and November (for Live Memories) peaking for the most usage.
Percent of the year on Twitter
12
That's 163 hours total.
Facebook clocked in second place at 34 hours.
Hours editing videos
56
Between Final Cut and Premiere Pro, split 5% and 95% respectively.
Projects
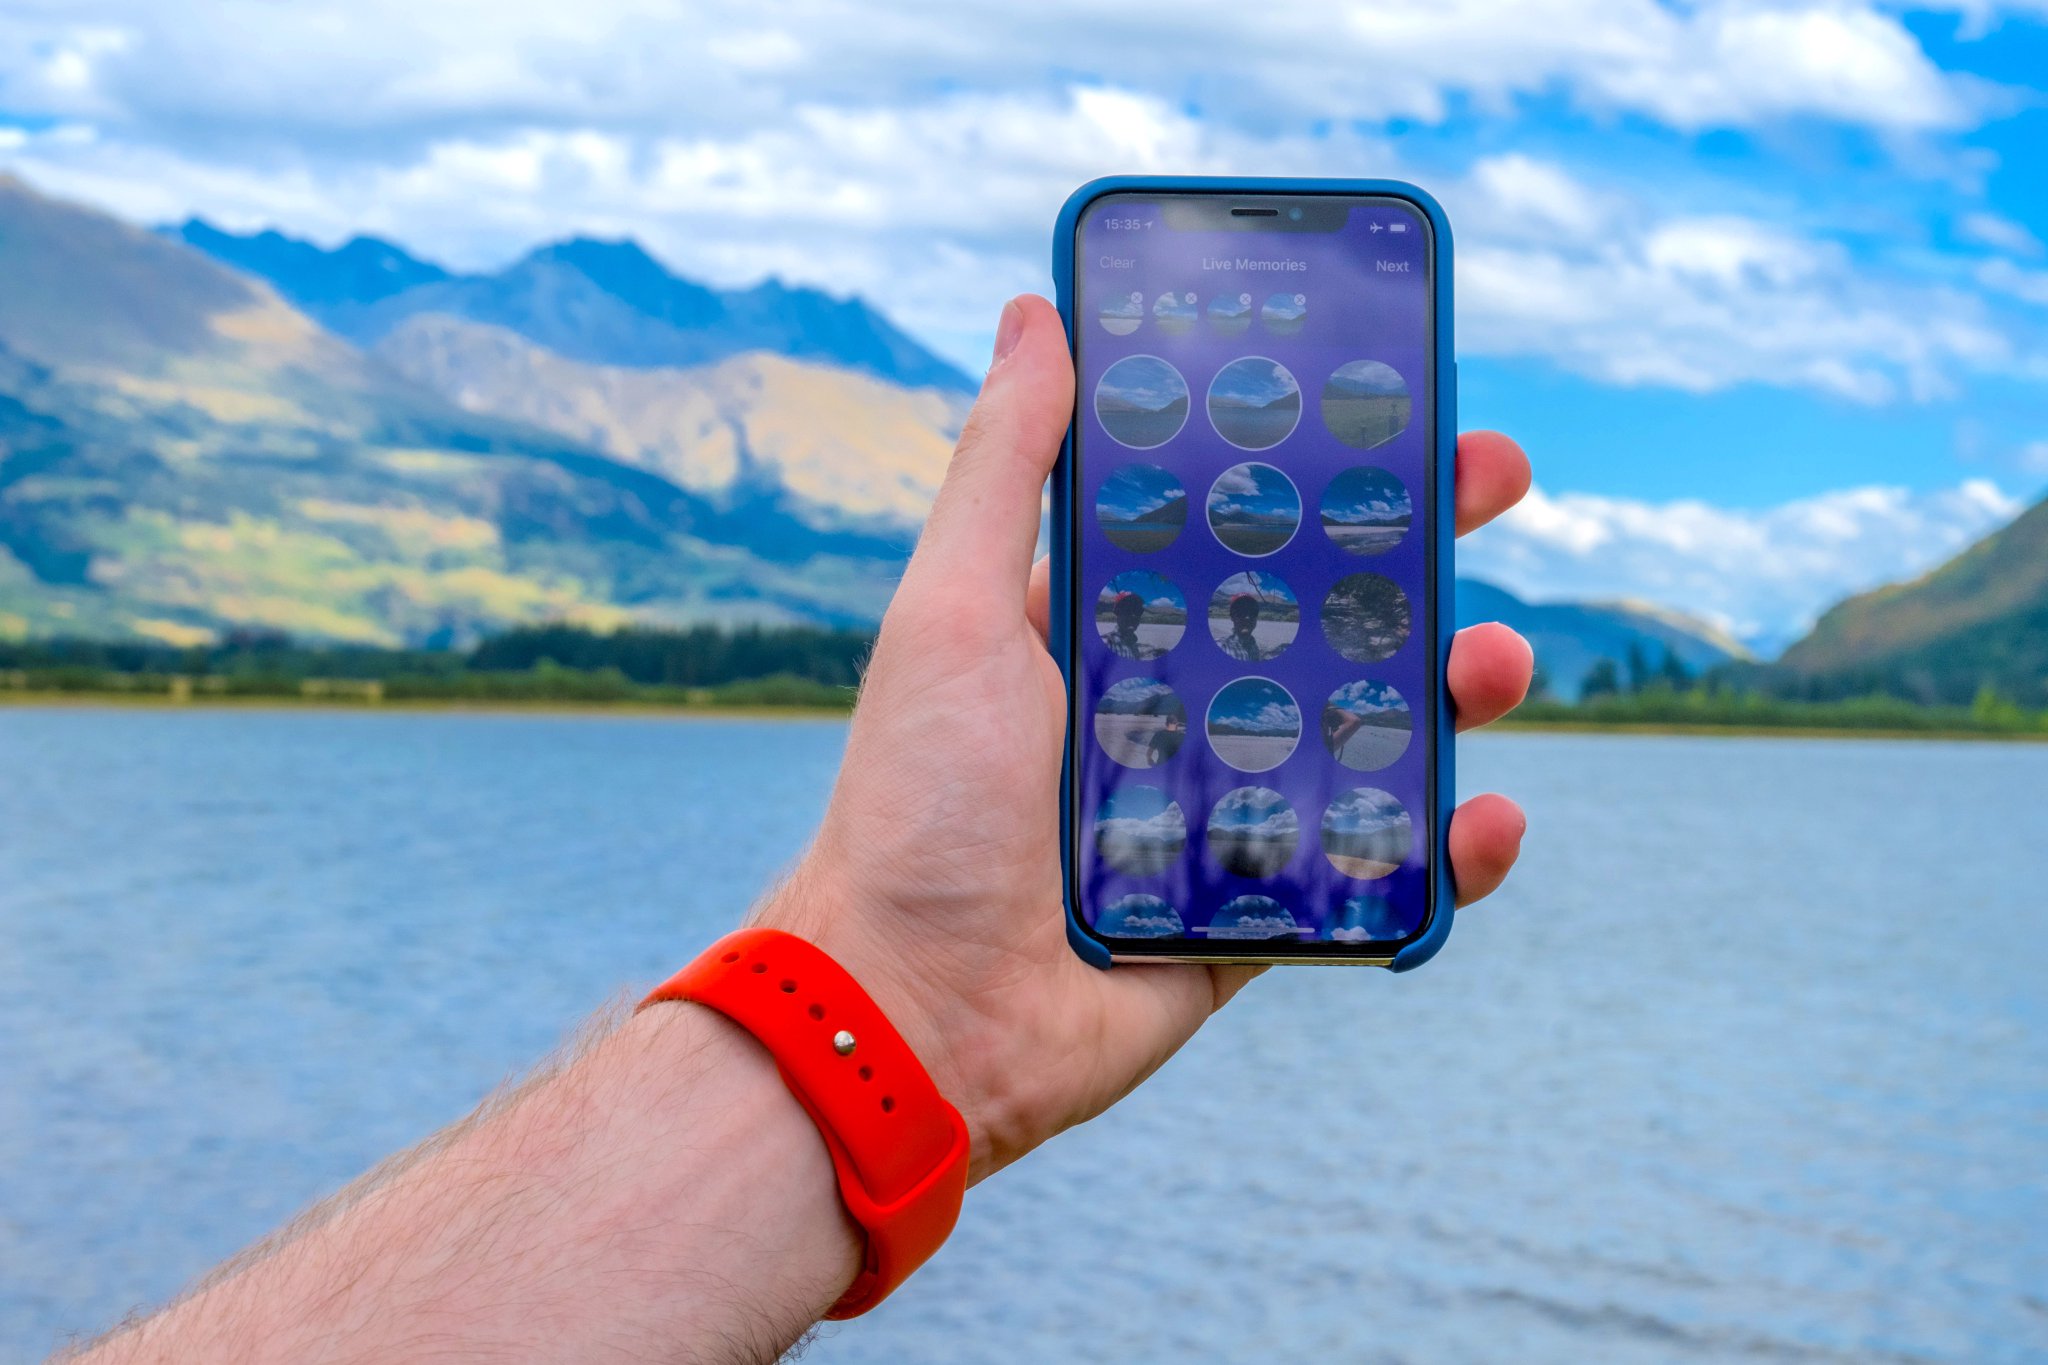
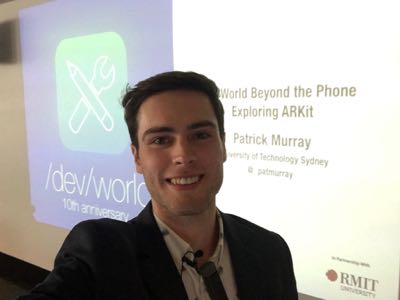
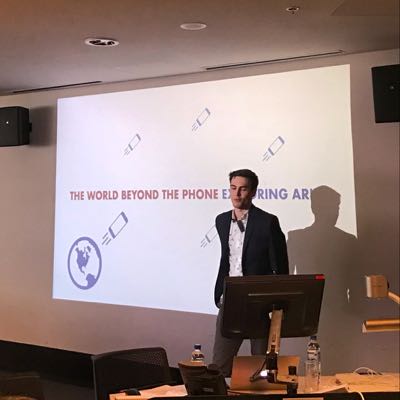
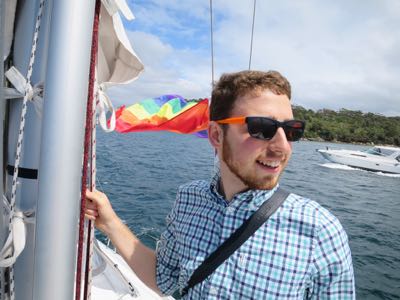
Beyond small hacks and my WWDC scholarship application, I published two major personal projects in 2017; Live Memories and Pride Codes.
Total Rainbows served in 2017
866,000
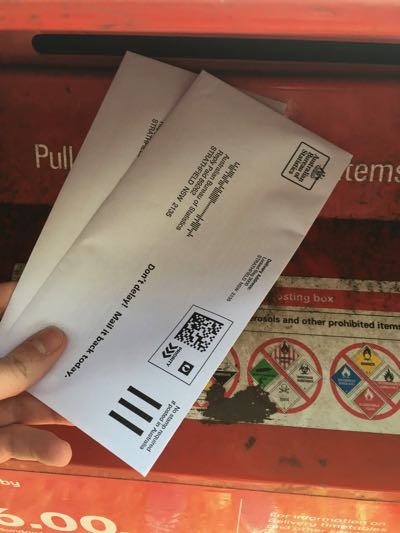
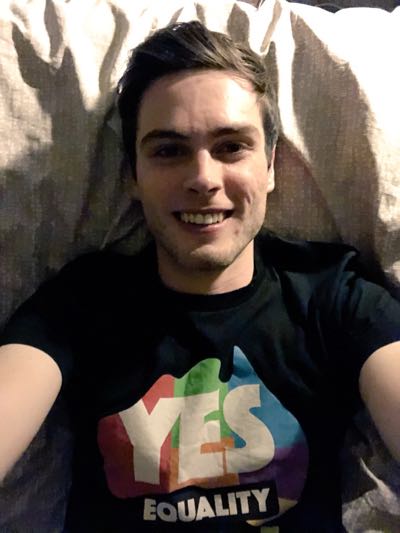
The majority being the Vote Yes Corner during the postal survey.
At time of publication (March 2018), Pride Codes has served over 1.1 million rainbows!
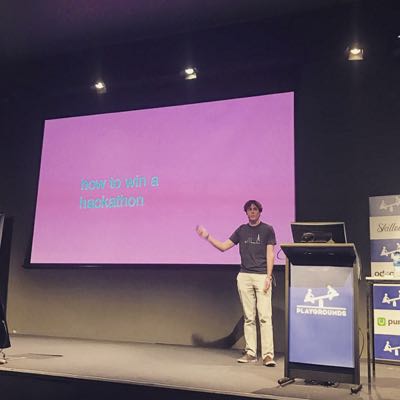
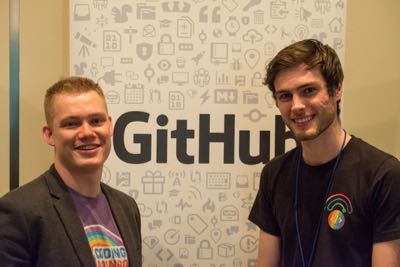
Pride Codes was the creation of Jack Skinner and myself over a few rushed nights in September 2017 as a reaction to the Australian Marriage Equality Postal Survey. The overwhelming success and reception of the project was amazing, and it was used on hundreds of websites. Jack spoke at GitHub's roadshow tour about the open source nature of such an emotionally charged project. I'm very proud of all that we built here.
Total Memories Created in 2017
13,450
With 9528 memories being abandoned on creation and 3922 being exported.
The highest day for ceation of memories was Christmas Eve.